Uncovering a few SIGSEGVs in binutils' BFD and GLIBC
Introduction
A few years ago I
released an ELF file format fuzzer, Melkor, and recently just came up with the
idea to fuzz the parsers in binutils’ BFD library, through ld
at the linking phase, and the parsers and loader(s) in GLIBC to see if there could be something
interesting.
To continue reading, all
the scripts, output and analysis can be downloaded from here:
Preamble
Before running we need to
walk; that said, we need to see the different scenarios where ELF files take
places when building an executable.
As explained in [1], when
you type gcc foo.c -o foo, gcc only performs the preprocessing and
compilation, and later on it acts a wrapper that launches the programs in
charge of the subsequent phases: assembly and linking, achieved by the GNU
assembler (as) and the GNU linker (ld)
respectively, and both part of GNU binutils. In the end, at the linking phase,
ELF files, particularly object files (.o) and shared objects (.so) (the blue
rectangle in the following picture) are linked
altogether to create the final outcome: an ELF executable.
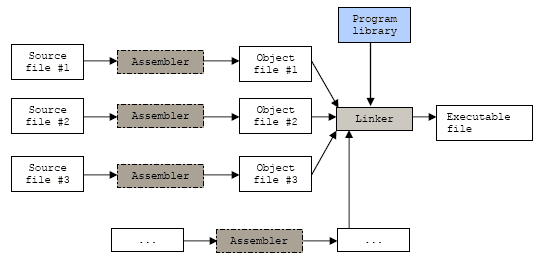
Image taken from http://www.tenouk.com/Bufferoverflowc/Bufferoverflow1c.html
Having understood that,
two targets to test fuzzed ELF files would be:
- At the linking phase: the linker (ld), which in turn uses the BFD library internally. BFD stands for “Binary File Descriptor” and is the main mechanism for the portable manipulation of object files in a variety of formats. As of 2003, it supports approximately 50 file formats for some 25 instruction set architectures. [3]
- At runtime: those executable files that were successfully created with malformed ELF objects and dynamic objects, will be executed to see how GLIBC’s runtime linker (aka dynamic linker or dynamic loader) parses and loads it in memory prior its execution.
Environment
Full details at:
OS:
nitr0us@bukowski:~$ uname -a
Linux bukowski 4.4.0-31-generic
#50-Ubuntu SMP Wed Jul 13 00:07:12 UTC 2016 x86_64 x86_64 x86_64 GNU/Linux
Versions installed:
- gcc 6.3.0
- binutils 2.27
- glibc 2.23
Binutils was compiled and
installed through the usual configure, make, make
install. The following CFLAGS
were used for debugging.
nitr0us@bukowski:~/binutils-2.27$ ./configure
CFLAGS='-ggdb -fno-stack-protector'
GLIBC’s debug symbols and
sources installed through apt-get:
nitr0us@bukowski:~$ sudo apt-get install
libc6-dbg
Reading package lists... Done
Building dependency tree
Reading state information... Done
The following packages will be upgraded:
libc-dev-bin libc6 libc6-dbg libc6-dev
nitr0us@bukowski:~$ sudo apt-get source libc6
Verifying the symbols and sources are
configured correctly with gdb:
nitr0us@bukowski:~$ gdb -q
/lib/x86_64-linux-gnu/libc-2.23.so
Reading symbols from
/lib/x86_64-linux-gnu/libc-2.23.so...Reading symbols from /usr/lib/debug//lib/x86_64-linux-gnu/libc-2.23.so...done.
done.
(gdb) info sources
Source files for which symbols have been read
in:
Source files for which symbols will be read
in on demand:
/build/glibc-t3gR2i/glibc-2.23/elf/interp.c,
/build/glibc-t3gR2i/glibc-2.23/elf/sofini.c,
/build/glibc-t3gR2i/glibc-2.23/elf/../sysdeps/unix/sysv/linux/dl-vdso.c,
...
(gdb) set substitute-path
/build/glibc-t3gR2i/ /home/nitr0us/
(gdb) info line __stack_chk_fail
Line 28 of "stack_chk_fail.c"
starts at address 0x118500 <__stack_chk_fail> and ends at 0x118507
<__stack_chk_fail>.
(gdb) list __stack_chk_fail
23
24
void
25
__attribute__ ((noreturn))
26
__stack_chk_fail (void)
27
{
28
__fortify_fail ("stack smashing detected");
29
}
Test
cases (aka fuzzing ELF files)
Full details at:
Depending upon the file
type, different internal metadata was fuzzed with the following script, which
takes a normal ELF file and creates 500 test cases, with different fuzzing
aggressiveness:
#!/bin/sh
m=H # metadata to fuzz
for x in foo_standalone.o foo.o
libfoo.o libfoo.so
do
for n in $@
do
./melkor -${m} templates/$x -l
$n -n 500 -q
sleep 1
mv orcs_${x} orcs_${x}_${m}${n}
sleep 1
done
done
All the created orcs
(malformed ELFs) are provided in the orcs_execs_scripts.tgz file at:
Finding
SIGSEGVs
Full details at:
- BFD
Once the corrupted files
were created, it’s time to link them through ld to
finally test the parsers in BFD. To do it in an automated fashion, a small bash
script was used. Also provided at the link at the beginning of the article.
For each dir inside the
orcs/ dir, test_fuzzed.sh had to be run and the result sent to a .txt:
./test_fuzzed.sh orcs/orcs_foo_standalone.o_XX/
gcc > results/orcs_foo_standalone.o_XX.txt
The results/ folder is
also supplied in the .tgz.

- GLIBC
If ld
didn’t crash when creating the executables, then, we proceed to execute them.
Three more execution runs were done with the LD_BIND_NOW,
LD_LIBRARY_PATH and LD_PRELOAD
fuzzed too.

Analyzing
SIGSEGVs
All the outputs in plain
text from the previous phase were parsed to find those malformed files that
caused the crashes and were sent to a file to be passed to gdb
in this phase. For example:
IFS=$'\n'; for x in $(grep -B 1 Segmentation
results/orcs_foo_standalone.o_s5.txt | egrep -v
"Segmentation|^\-\-$"); do echo $x; done | cut -d ' ' -f 30 >
sigsegvs
To automate the analysis,
the following gdb script was used:
nitr0us@bukowski:~$ cat bt.gdb
set substitute-path
/build/glibc-t3gR2i/ /home/nitr0us/
set follow-fork-mode child
r
echo #####################################################\n
bt
echo
#####################################################\n
info source
echo
#####################################################\n
x/20i $rip-30
echo
#####################################################\n
i r
echo
#####################################################\n
quit
Also an alias was created
in ~/.bashrc:
alias gdb='gdb -q -x bt.gdb
--args'
- BFD
Full details at:
For each line in the
sigsegvs file, gdb was launched, which was an alias for gdb
with parameters and the bt.gdb script executed. The big list of parameters are
all that ld (through collect2)
use at linking phase. This could be seen when you compile something with
verbose (e.g. gcc foo.c -o foo
-v). All this output sent
to the gdb.txt file:
for x in $(cat sigsegvs); do echo
"###### $x ######" >> gdb.txt && gdb
/usr/local/libexec/gcc/x86_64-pc-linux-gnu/6.3.0/collect2 -plugin
/usr/local/libexec/gcc/x86_64-pc-linux-gnu/6.3.0/liblto_plugin.so
-plugin-opt=/usr/local/libexec/gcc/x86_64-pc-linux-gnu/6.3.0/lto-wrapper
-plugin-opt=-fresolution=/tmp/ccG2zZ9n.res -plugin-opt=-pass-through=-lgcc
-plugin-opt=-pass-through=-lgcc_s -plugin-opt=-pass-through=-lc -plugin-opt=-pass-through=-lgcc
-plugin-opt=-pass-through=-lgcc_s --eh-frame-hdr -m elf_x86_64 -dynamic-linker
/lib64/ld-linux-x86-64.so.2 -o execs/exec_$RANDOM
/usr/lib/x86_64-linux-gnu/crt1.o /usr/lib/x86_64-linux-gnu/crti.o
/usr/local/lib/gcc/x86_64-pc-linux-gnu/6.3.0/crtbegin.o
-L/usr/local/lib/gcc/x86_64-pc-linux-gnu/6.3.0
-L/usr/local/lib/gcc/x86_64-pc-linux-gnu/6.3.0/../../../x86_64-linux-gnu
-L/usr/local/lib/gcc/x86_64-pc-linux-gnu/6.3.0/../../../../lib64
-L/lib/x86_64-linux-gnu -L/lib/../lib64 -L/usr/lib/x86_64-linux-gnu
-L/usr/local/lib/gcc/x86_64-pc-linux-gnu/6.3.0/../../../../x86_64-pc-linux-gnu/lib
-L/usr/local/lib/gcc/x86_64-pc-linux-gnu/6.3.0/../../.. -lgcc --as-needed
-lgcc_s --no-as-needed -lc -lgcc --as-needed -lgcc_s --no-as-needed
/usr/local/lib/gcc/x86_64-pc-linux-gnu/6.3.0/crtend.o /usr/lib/x86_64-linux-gnu/crtn.o
$x; done &>> gdb.txt
Finally, details of the
crashes inside gdb.txt.

- GLIBC
Full details at:
The same procedure
describe above was used.
I guess the most
interesting SIGSEGVs are the ones corresponding to the
Dynamic Linker (/home/nitr0us/glibc-2.23/elf/dl-*.c).

SIGSEGVs
count
Full details at:
After parsing the gdb’s
output, following the unique crashes count:
- BFD

- GLIBC

Bug
reporting
I had time only to
perform the fuzzing process and to dump basic info with gdb
with basic shell scripting, as shown above. However, haven’t had time to go
through the source code and see what’s going on in detail and to see if there
are some crashes that might have impact in security (i.e. memory corruption
vulnerabilities, off-by-one, integer overflows, etc. etc.).
Therefore, if you have
some spare time in your agenda, I encourage you to analyze the source code to
find – and fix if possible – the root causes of these crashes.
Thanks for reading.
- Alejandro
[1] How to Compile and
Run C Program in Linux Using gcc?
[2]
A Compiler, Assembler, Linker & Loader
[3]
Binary File Descriptor library
Comentarios
Publicar un comentario